Hello everyone,
I’m currently working on a dashboard that displays validation checks using visualizations. Here’s an example of one of the checks I’m implementing:
Validation Check:
Number of suspected malaria cases == Number of malaria cases tested + Number of malaria cases referred
To perform this logical check in a visualization, I’m using the following equation:
1 / (((x - 1)^2) * B + 1)
Here, x is a fraction where the numerator is the Number of suspected malaria cases and the denominator is Number of malaria cases tested + Number of malaria cases referred. When these values are equal, x equals 1; otherwise, it takes on a non-zero value.
The constant B is a large number that ensures the result is approximately 0 if the values don’t match. When they do match, the squared term cancels out, resulting in a value of 1.
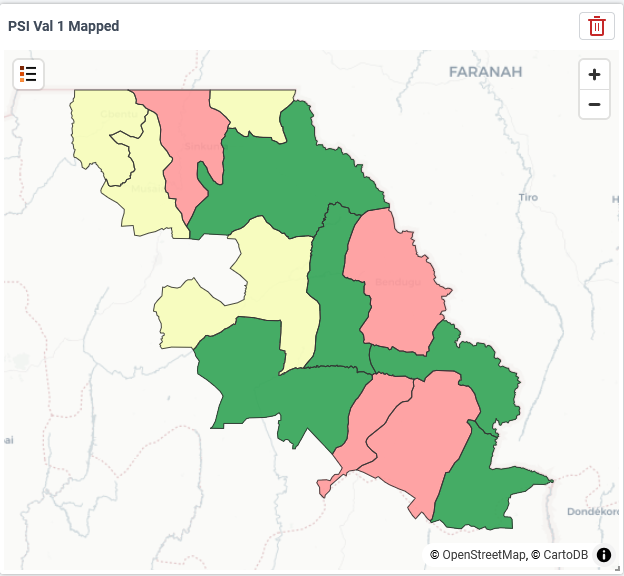
Example Validation Plot:
- 1 (Pass) is shown in green
- 0 (Fail) is yellow
- No data is pink
![Example Plot]()
This approach seems a bit complex for a straightforward logical check, so I’m wondering if there’s a more efficient way to accomplish this in a dashboard, potentially using a different tool or functionality. I looked into the interactive scorecard, which changes colors based on values, but I need additional flexibility to calculate pass rates and perform other operations on the data.
Does anyone have suggestions for achieving this in a dashboard, or would using Python or another tool be better suited for this task?
Thank you!
3 posts - 2 participants