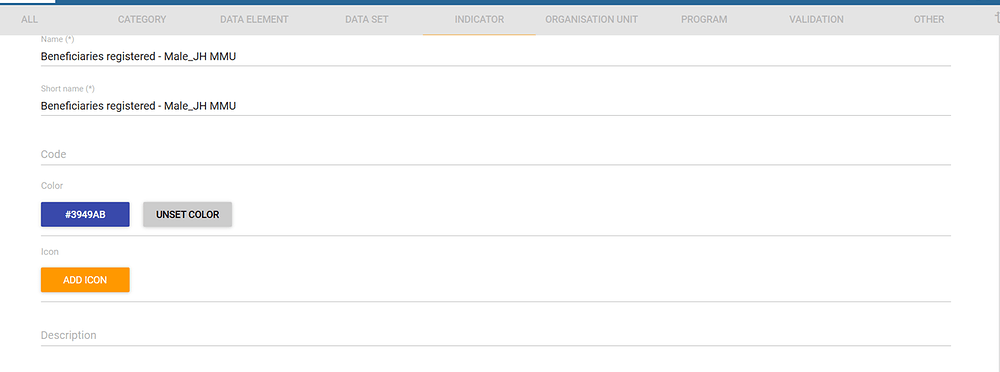
We have created a PI for Gender - Blue for Male , Pink for Female, Green for TG and Purple for Gender not disclosed. Then we created a Column chart in Data Visualizer with these PIs but the colors are not depicting in the Column chart. We are using 2.40.4. Please guide


1 post - 1 participant