I want to understand how Totals are calculated when visualizing data using pivot tables:
Disclaimer: The data dimensions selected in the given images might not make sense, but this will help me to understand how DHIS2 come up with the row-totals, row-subtotals, likewise the columns.
This output is from DHIS2 play instance version 2.40
Below are two images that outputs totals.
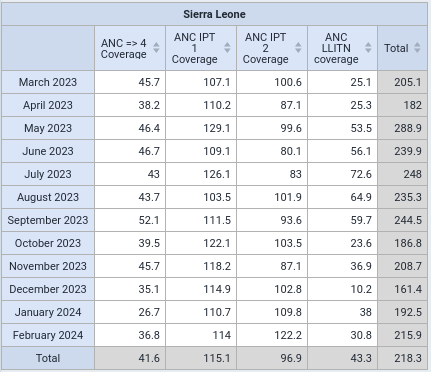
First Image
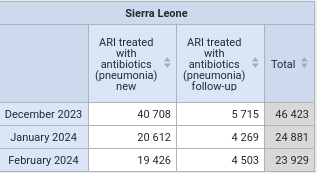
The second image Output
Thank you.
1 post - 1 participant